Monitor data delivery progress in the Cloud Console
After you enable the Lakehouse Table on a topic, the StreamNative Cloud Console shows a per-topic delivery dashboard. Use it to check the health of data delivery without any external monitoring setup. Open a topic in the Cloud Console and select the Lakehouse Table tab.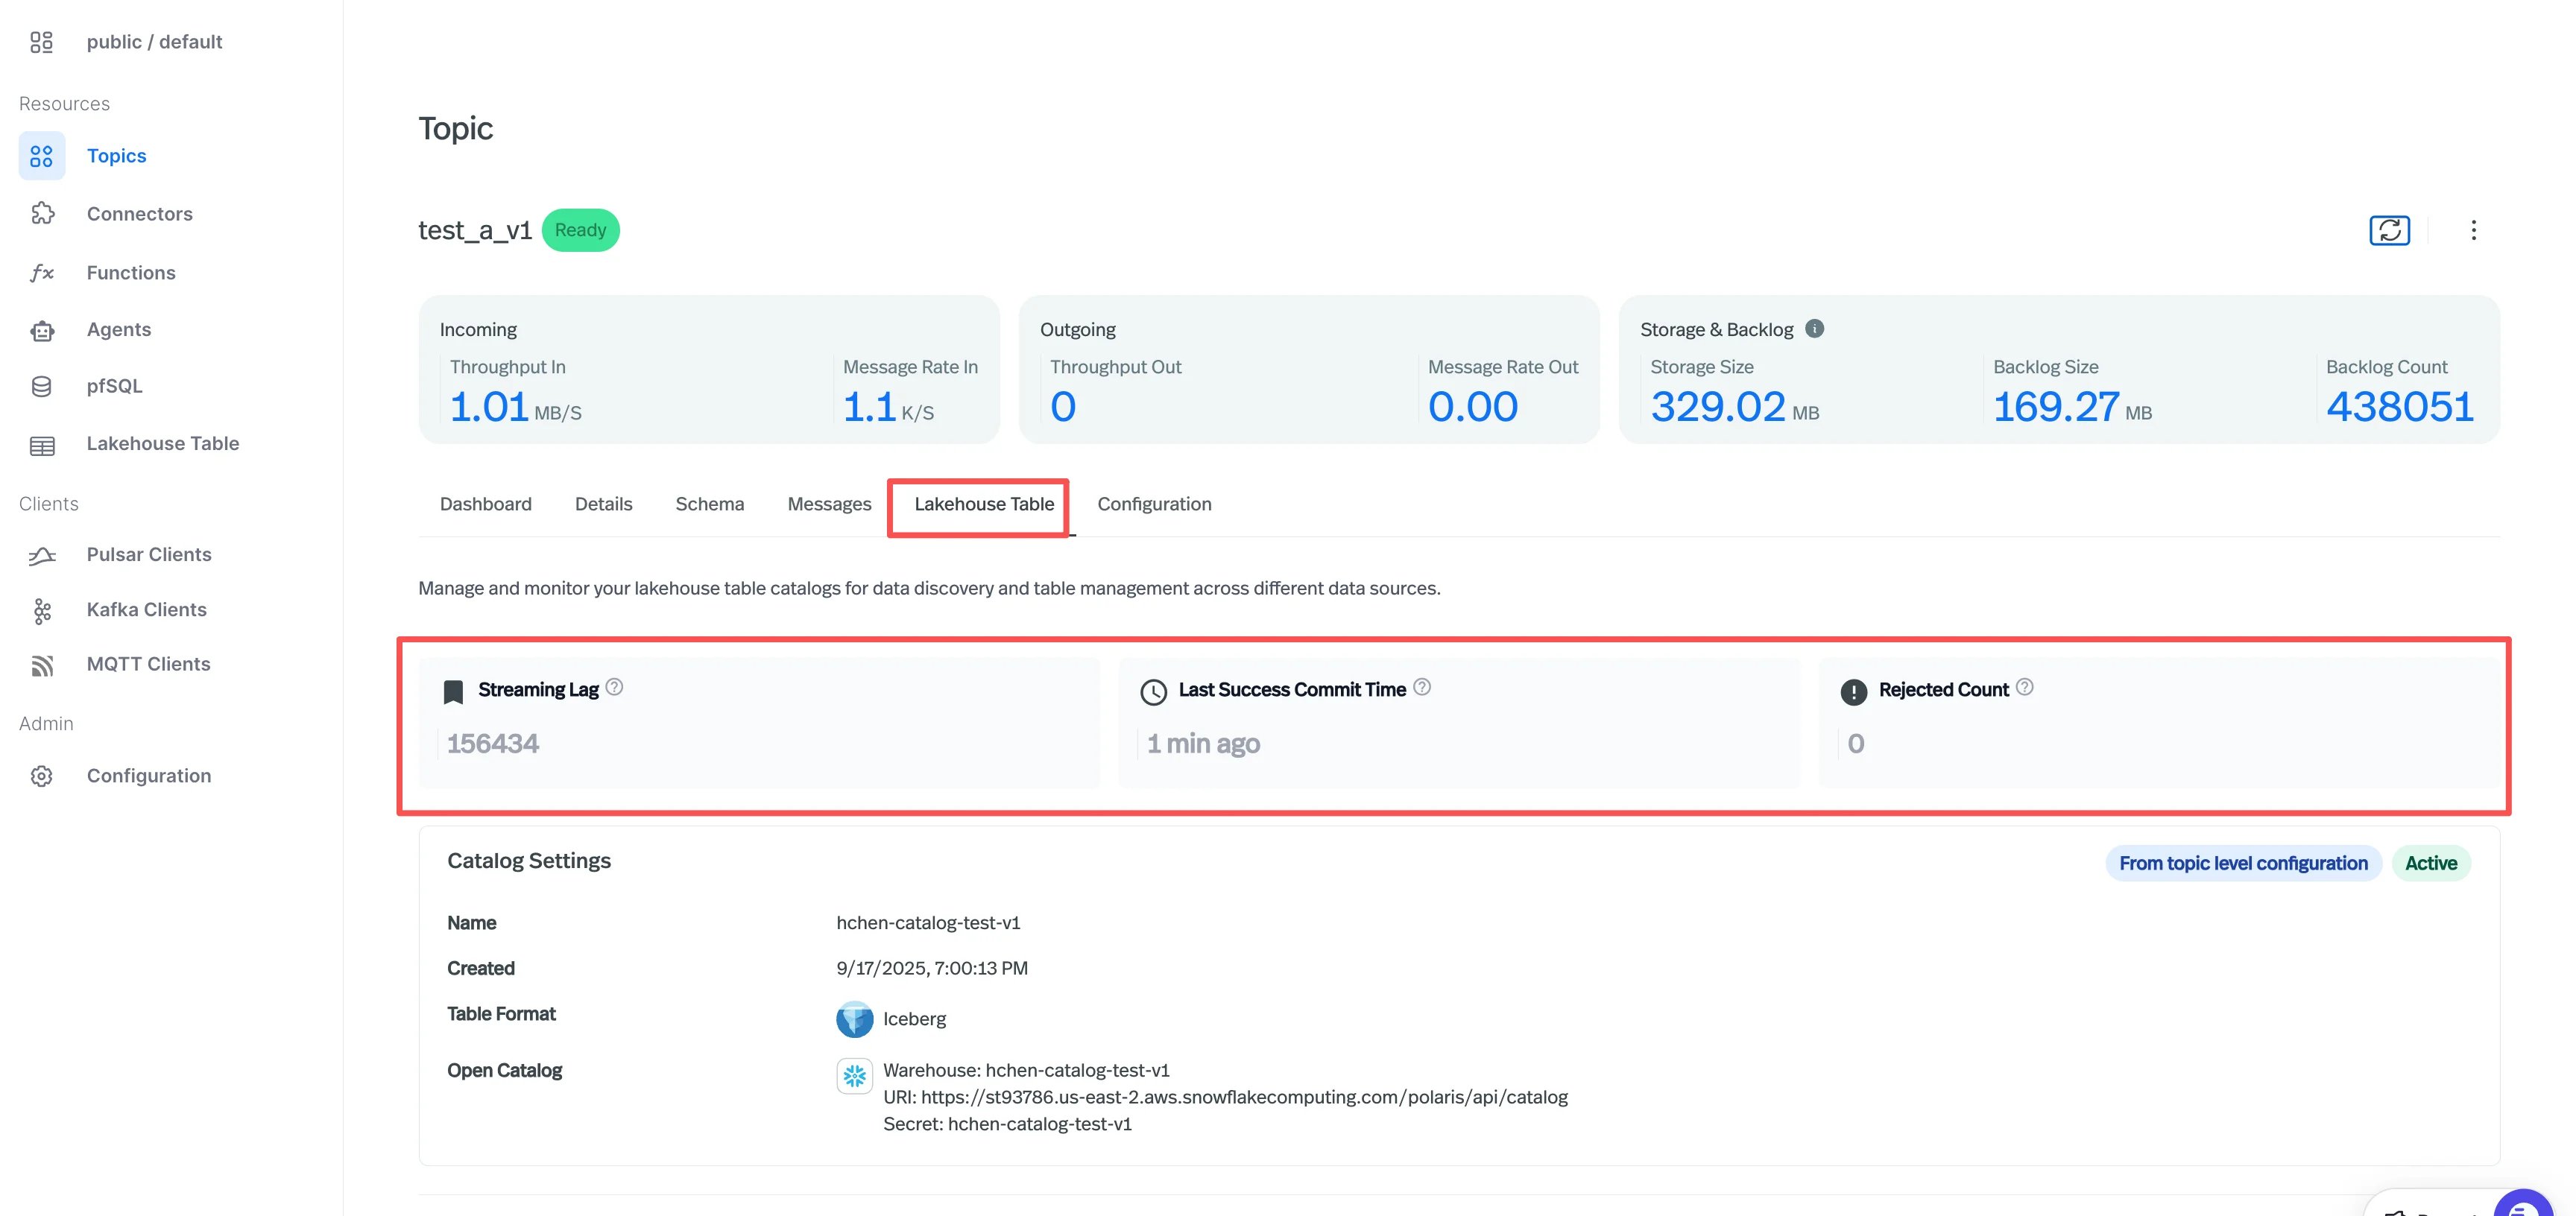
The Catalog Settings panel below confirms which catalog the topic is delivering to and shows whether the setting is inherited from the cluster, the namespace, or set directly on the topic. See Configuration override priority for how the effective catalog is resolved.
Prerequisites
Before you can visualize Lakehouse metrics in your own Grafana instance, enable Metrics Remote Write on your Cloud Environment to forward StreamNative Cloud metrics to your Prometheus-compatible monitoring system or Datadog.Grafana Dashboard
A pre-built Grafana dashboard is available asCompactionScheduler.json in the apache-pulsar-grafana-dashboard repository. Import it into your Grafana instance for comprehensive monitoring.
How to Import
- Download
CompactionScheduler.jsonfrom the repository. - Open Grafana -> Dashboards -> Import.
- Upload
CompactionScheduler.jsonor paste the JSON content. - Select your Prometheus data source.
- Click Import.