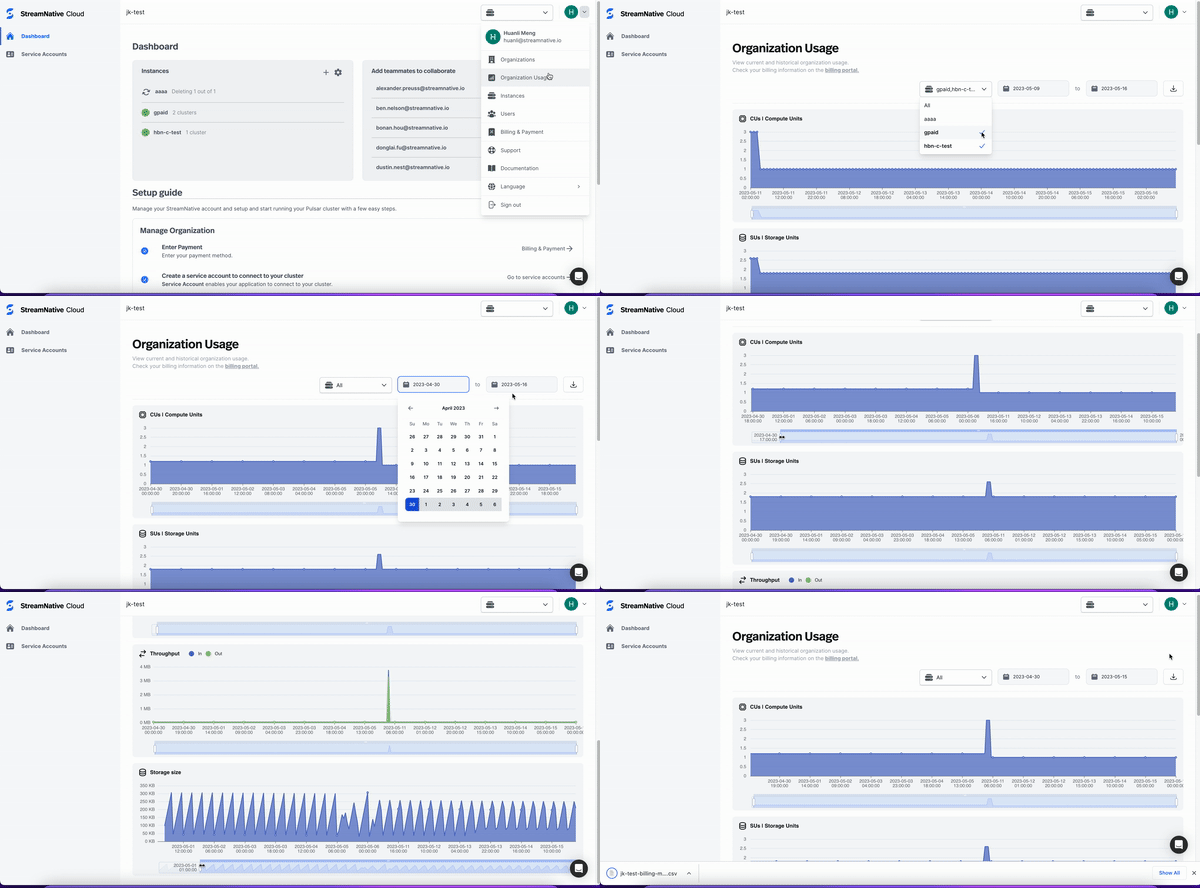
StreamNative Cloud provides real-time and historical data usage for all instances in your organization through the Organization Usage page on StreamNative Cloud Console, whether you subscribe to the StreamNative Cloud service through StreamNative website or Marketplace channels.Documentation Index
Fetch the complete documentation index at: https://docs.streamnative.io/llms.txt
Use this file to discover all available pages before exploring further.
View usage details
To view your real-time and historical data usage, follow these steps.-
In the upper-right corner of the StreamNative Cloud Console, click your Profile and select Organization Usage.

-
Select the target instance and set the billing period.
By default, all instances are selected and a 7-day billing period starting from the current date is set. You can view up to the past 60 days of usage based on the usage dimensions.
The metrics displayed vary based on your cluster profile type:
Latency Optimized Clusters:
- CUs | Compute Units: View how many CUs are committed by your Pulsar brokers or proxies. Clusters with Latency Optimized Profile use fixed resource allocation.
- SUs | Storage Units: View how many SUs are committed for BookKeeper and ZooKeeper storage in your organization.
- Functions | Function Processing Units: View how many FPUs are committed by your functions and connectors (only visible for function-enabled clusters).
- Throughput: View the total amount (in gigabytes) of data produced and consumed (only visible for Dedicated clusters).
- Storage size: View the total amount (in gigabytes) of data stored in your cluster (only visible for Dedicated clusters).
Cost Optimized Clusters:
- ETUs | Elastic Throughput Units: View how many ETUs are consumed by your clusters. ETUs provide dynamic, usage-based resource allocation that automatically scales with your actual throughput needs. Unlike clusters with Latency Optimized Profile, the clusters with Cost Optimized Profile use ETUs instead of separate CUs and SUs. Clusters with Cost Optimized Profile have a minimum allocation of 1 ETU.
- Functions | Function Processing Units: View how many FPUs are committed by your functions and connectors (only visible for function-enabled clusters).
For Serverless clusters:
- ETUs | Elastic Throughput Units: View how many ETUs are consumed by your clusters. Serverless clusters use consumption-based pricing with automatic scaling. Currently, Serverless clusters start from 0 ETUs, though a minimum of 1 ETU may be introduced in the future.
- Functions | Function Processing Units: View how many FPUs are committed by your functions and connectors (only visible for function-enabled clusters).
- Throughput: View the total amount (in gigabytes) of data produced and consumed.
- Storage size: View the total amount (in gigabytes) of data stored in your cluster.
Serverless clusters and clusters with Cost Optimized Profile use a simplified architecture without BookKeeper or ZooKeeper, so you won’t see separate Storage Units (SUs). All compute and storage resources are managed through ETUs. - (Optional) Use the slider under each chart to view hourly-reported usage.
Export your usage data to a CSV file
You can export a summary of your organization usage to a CSV file (.csv). By exporting your CSV file, you can easily find the usage and cost information for your organization or understand more about your costs.
- In the upper-right corner of the StreamNative Cloud Console, click your Profile and select Organization Usage.
- Select the target instances and the billing period, and then click the Download icon.