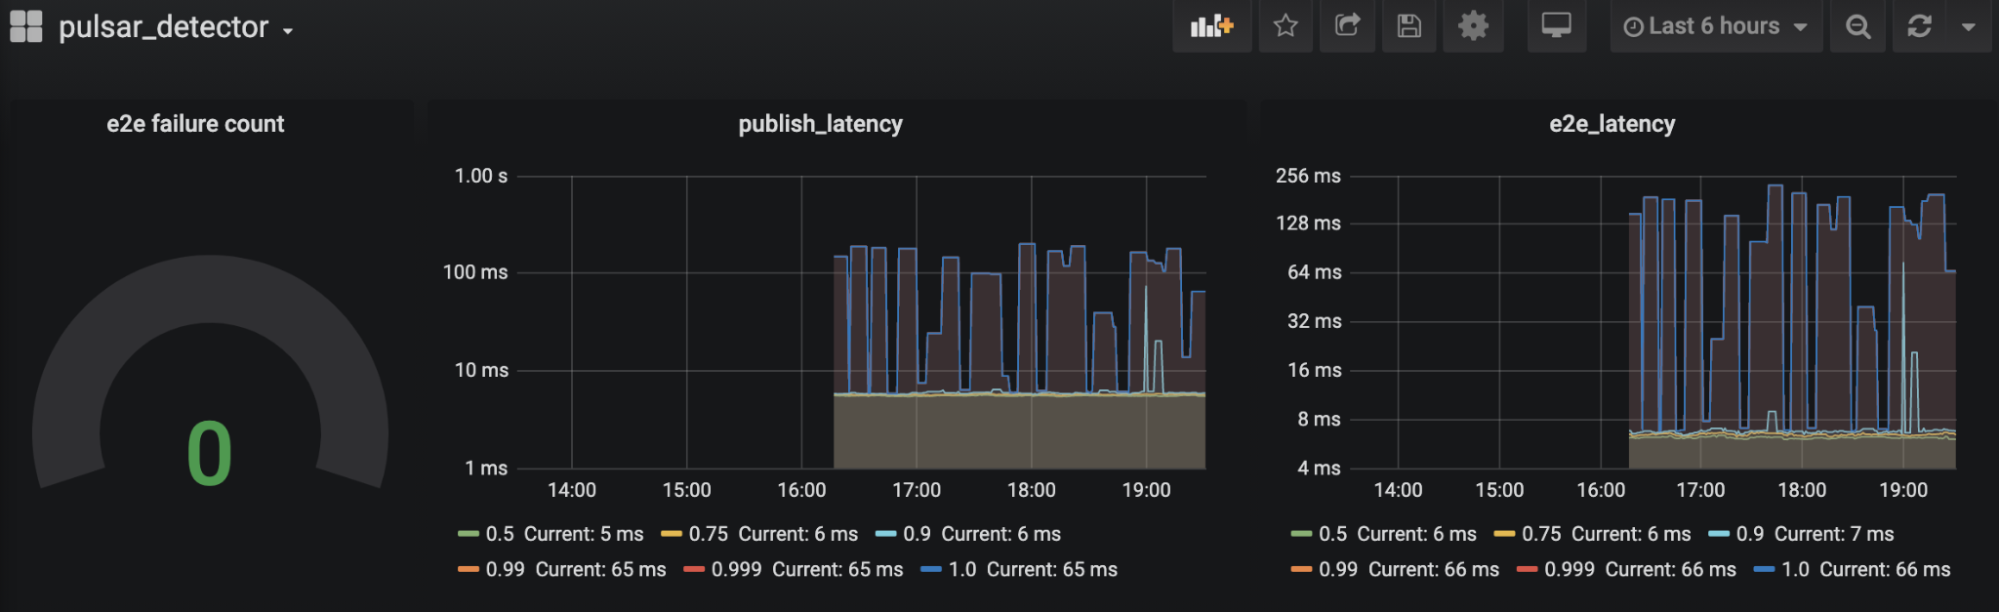
The Pulsar detector monitors the health of Pulsar clusters. When you need to monitor the distribution latency from message sending to message consumption in one cluster or across clusters, you can use the Pulsar detector. The Pulsar detector enables you to easily integrate with existing monitoring tools like Prometheus, and check the critical metrics in Grafana.Pulsar detector is enabled by default in StreamNative Platform. To check the health status of your Pulsar cluster, you can check it in your pulsar_detector dashboard in Grafana. The following is an example.To disable the tool, you can set pulsar_detector to false in your ${PLATFORM_HOME}/pulsar/values.yaml file.