Open Grafana in your browser
StreamNative Platform supports exposing the Grafana service. You can access the Grafana Dashboard through the following URL.
Use Grafana Dashboard
Grafana provides the following dashboards including brokers, bookies, ZooKeeper, proxy, topic, messages, and so on.- Overview: Displays the overview health of a Pulsar cluster.
- Messaging Metrics: Displays the metrics related to Pulsar messaging (such as producers, consumers, message backlog and so on).
- Proxy Metrics: Displays the metrics related to Pulsar proxies if you have run proxies in your Pulsar cluster.
- Bookie Metrics: Displays the metrics related to Bookies.
- ZooKeeper: Displays the metrics related to ZooKeeper cluster.
- JVM Metrics: Displays the JVM related metrics of all the components in a Pulsar cluster (such as proxies, brokers, bookies, and so on).
- Functions metrics: Displays the metrics related to Pulsar Functions.
- Auto Recovery: Displays the metrics related to auto-recovery.
- Container: Displays the metrics related to the container.
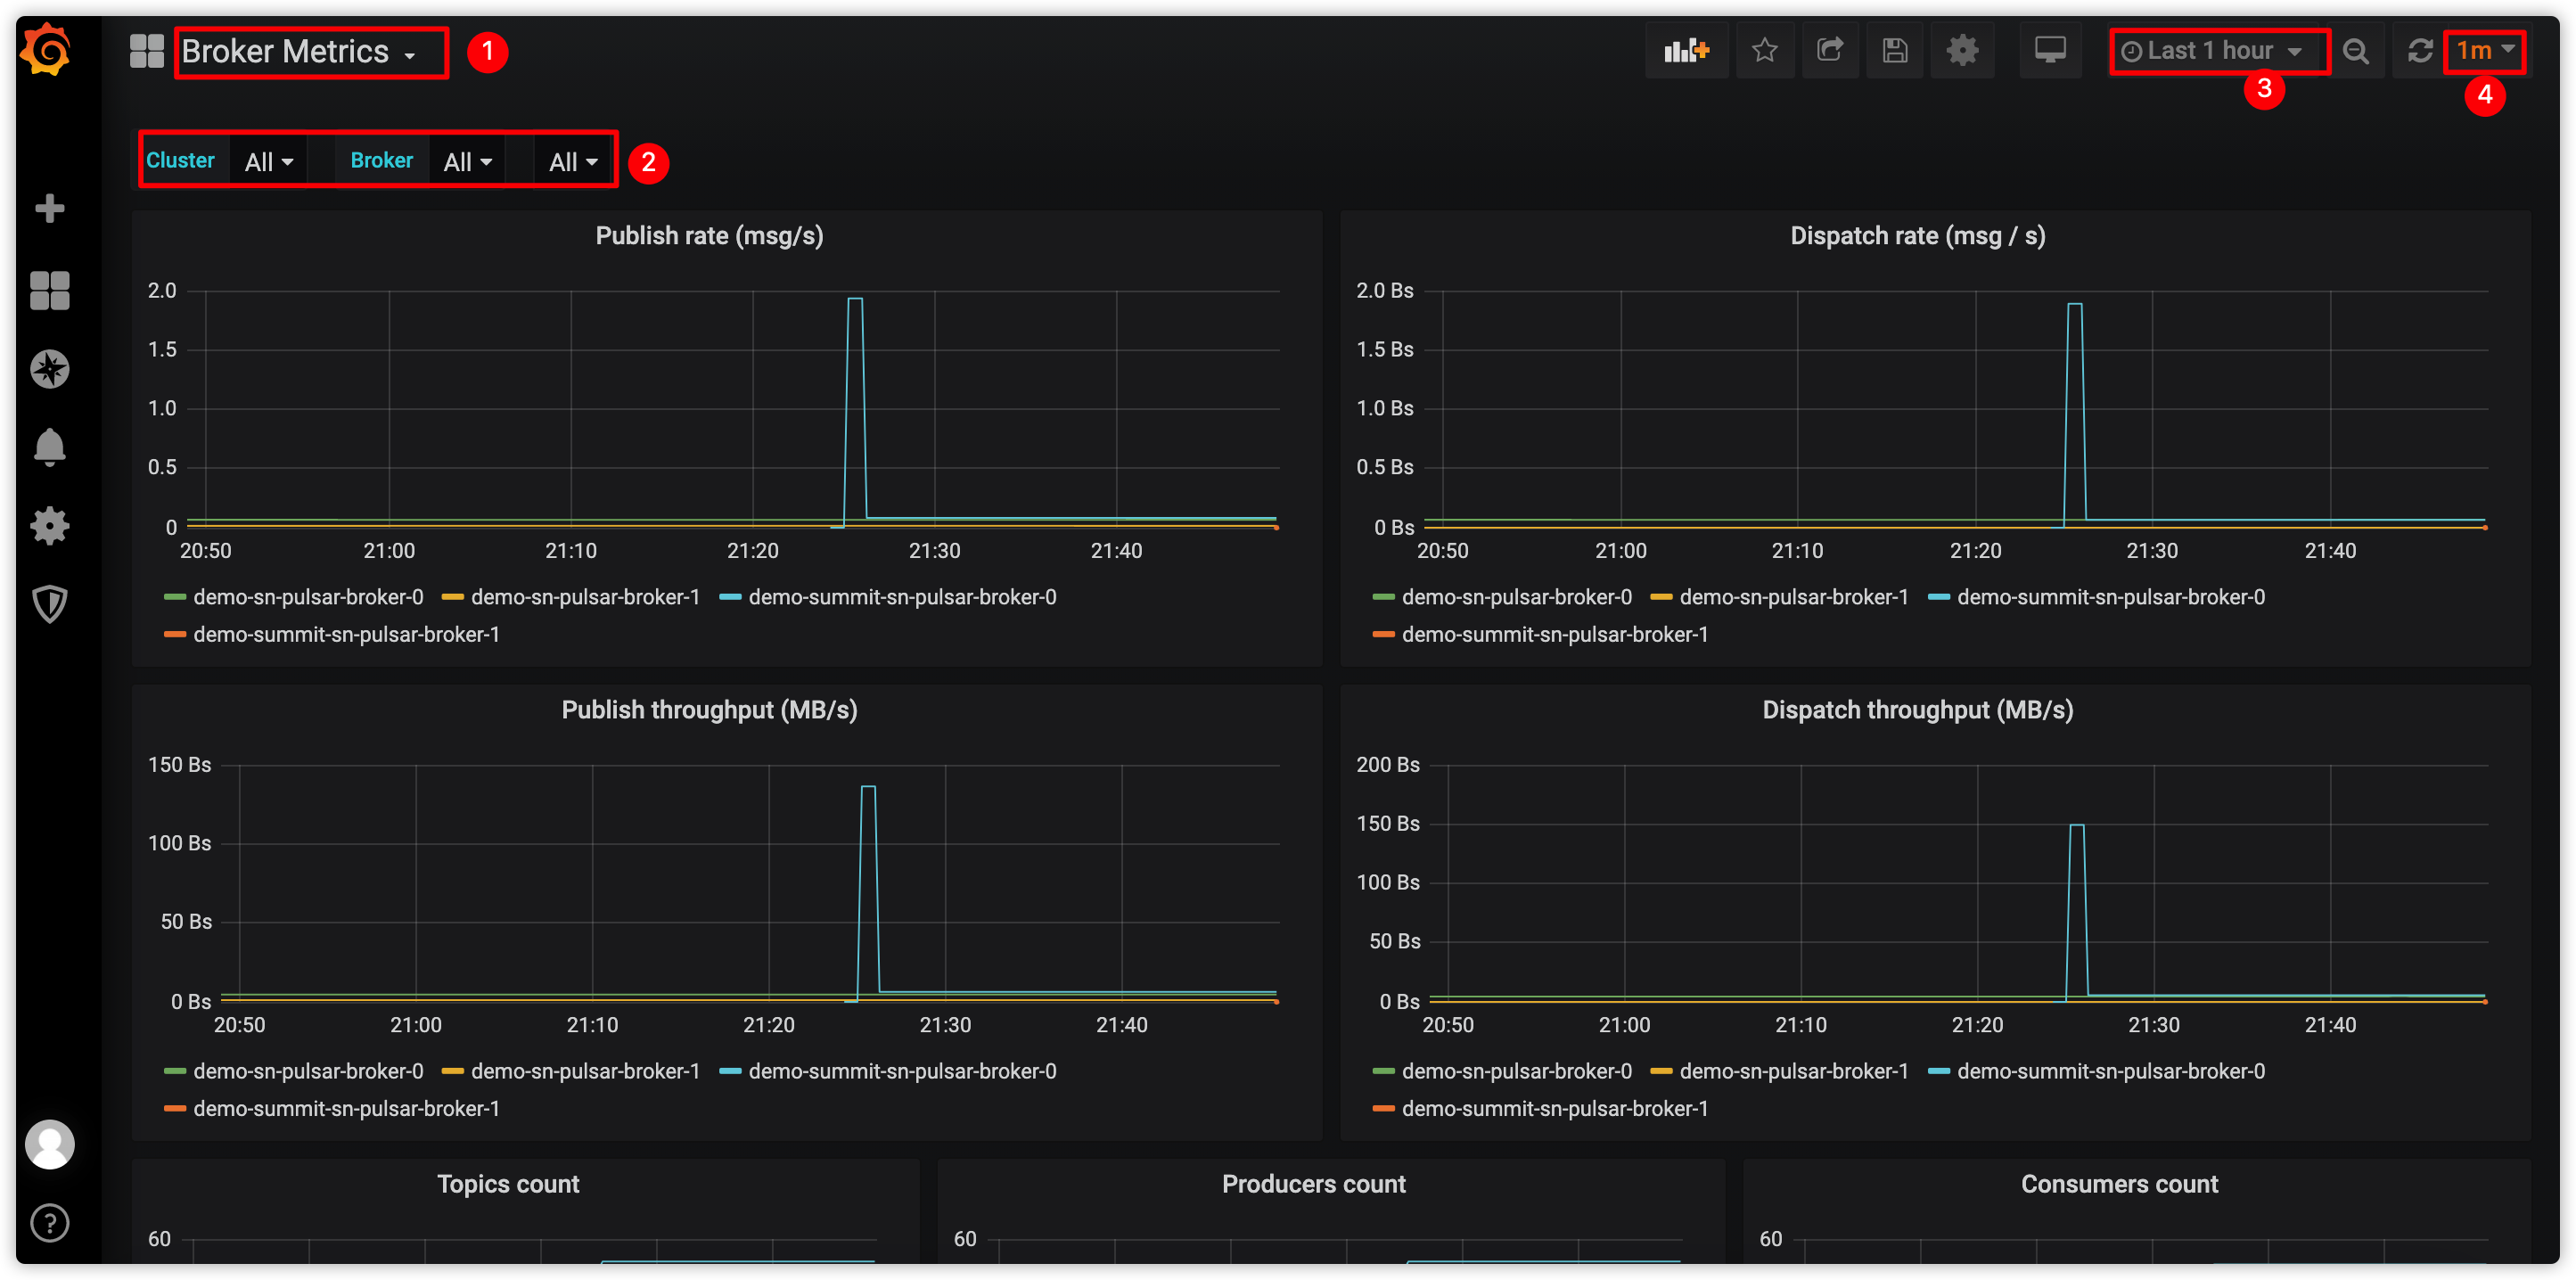
| No. | Action |
|---|---|
| 1 | Select a Broker Dashboard from the drop-down list. |
| 2 | Select to monitor all brokers or a specific broker. |
| 3 | Configure the time period for collecting the metrics. |
| 4 | Configure the interval for refreshing the dashboard. |