pulsar_detector to false in your ${PLATFORM_HOME}/pulsar/values.yaml file.
Metrics
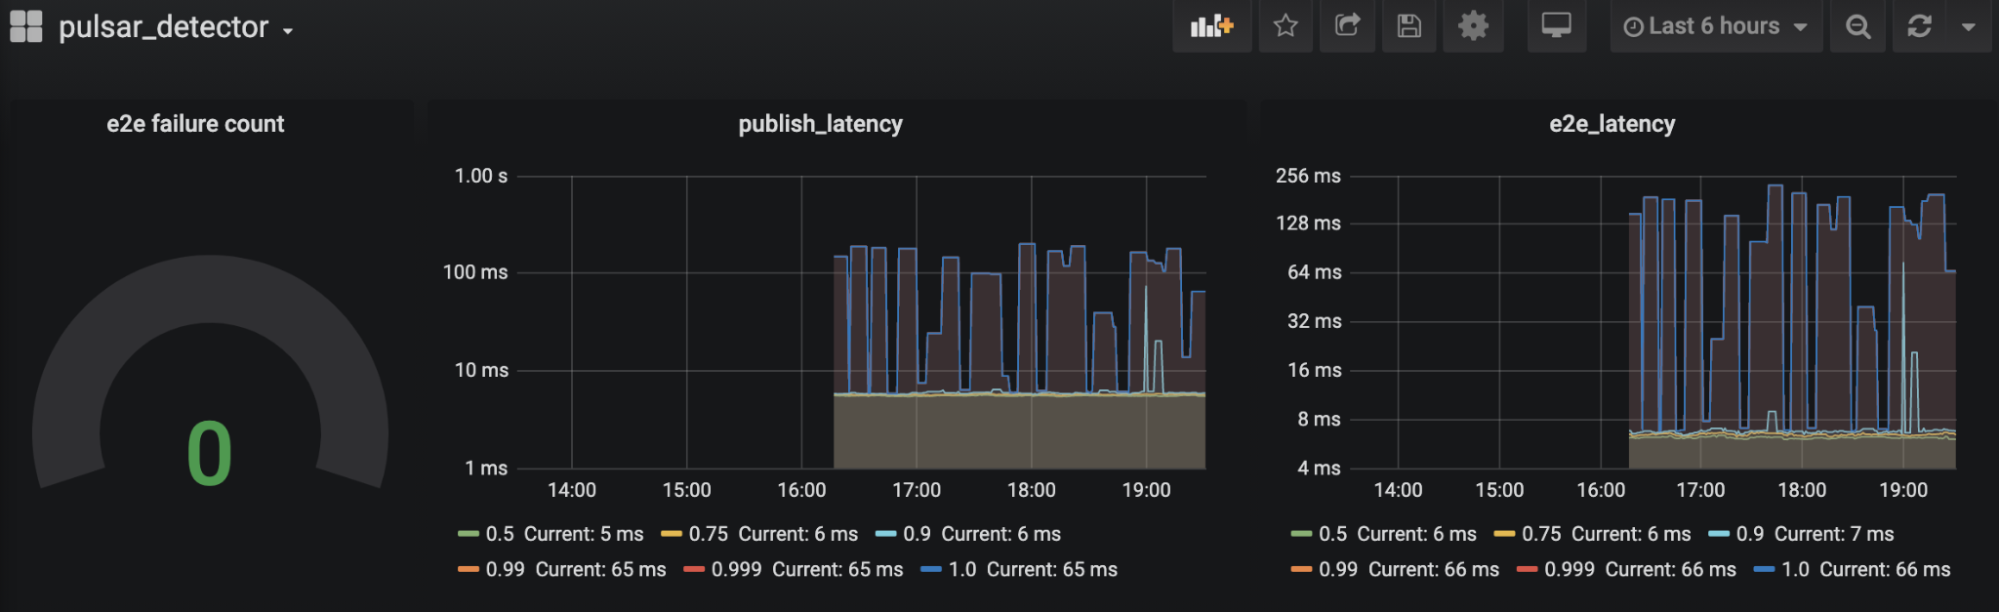
Pulsar detector supports the following metrics. You can check the complete list of metrics in Grafana.| Name | Type | Description |
|---|---|---|
| pulsar_detector_e2e_latency_ms | Summary | The distribution latency from message sending to message consumption. |
| pulsar_detector_publish_latency_ms | Summary | The distribution latency of message sending. |
| pulsar_detector_geo_latency_ms | Summary | The distribution latency from message sending to message consumption across clusters. |
| pulsar_sla_messaging_up | Gauge | Whether the message publishing service is running. |
| pulsar_sla_webservice_up | Gauge | Whether the webservice is running. The value 1 means the webservice is running. The value 0 means the webservice is not running. |