> ## Documentation Index
> Fetch the complete documentation index at: https://docs.streamnative.io/llms.txt
> Use this file to discover all available pages before exploring further.
# Monitor StreamNative Platform with Grafana Dashboard
All StreamNative Platform components expose metrics that can be scraped by Prometheus. You can configure Grafana to visualize those metrics in a dashboard.
This document describes how to monitor the StreamNative Platform with the Grafana dashboard.
## Open Grafana in your browser
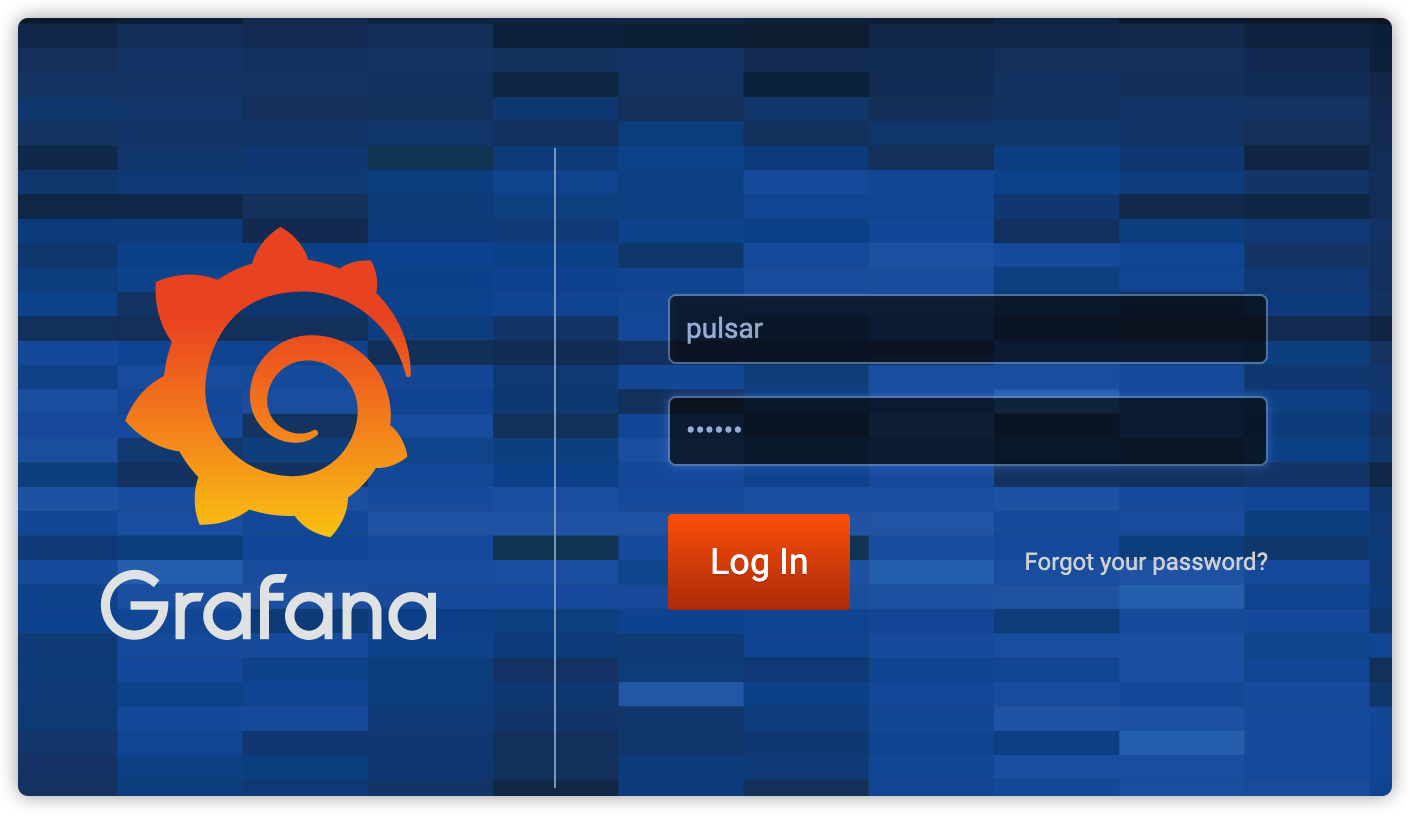
StreamNative Platform supports [exposing the Grafana service](/private-cloud/v1/monitor/grafana). You can access the Grafana Dashboard through the following URL.
 ## Use Grafana Dashboard
Grafana provides the following dashboards including brokers, bookies, ZooKeeper, proxy, topic, messages, and so on.
* *Overview*: Displays the overview health of a Pulsar cluster.
* *Messaging Metrics*: Displays the metrics related to Pulsar messaging (such as producers, consumers, message backlog and so on).
* *Proxy Metrics*: Displays the metrics related to Pulsar proxies if you have run proxies in your Pulsar cluster.
* *Bookie Metrics*: Displays the metrics related to Bookies.
* *ZooKeeper*: Displays the metrics related to ZooKeeper cluster.
* *JVM Metrics*: Displays the JVM related metrics of all the components in a Pulsar cluster (such as proxies, brokers, bookies, and so on).
* *Functions metrics*: Displays the metrics related to Pulsar Functions.
* *Auto Recovery*: Displays the metrics related to auto-recovery.
* *Container*: Displays the metrics related to the container.
*System metrics* are displayed in the *Node Metrics* dashboard and some portions in *Overview* dashboard.
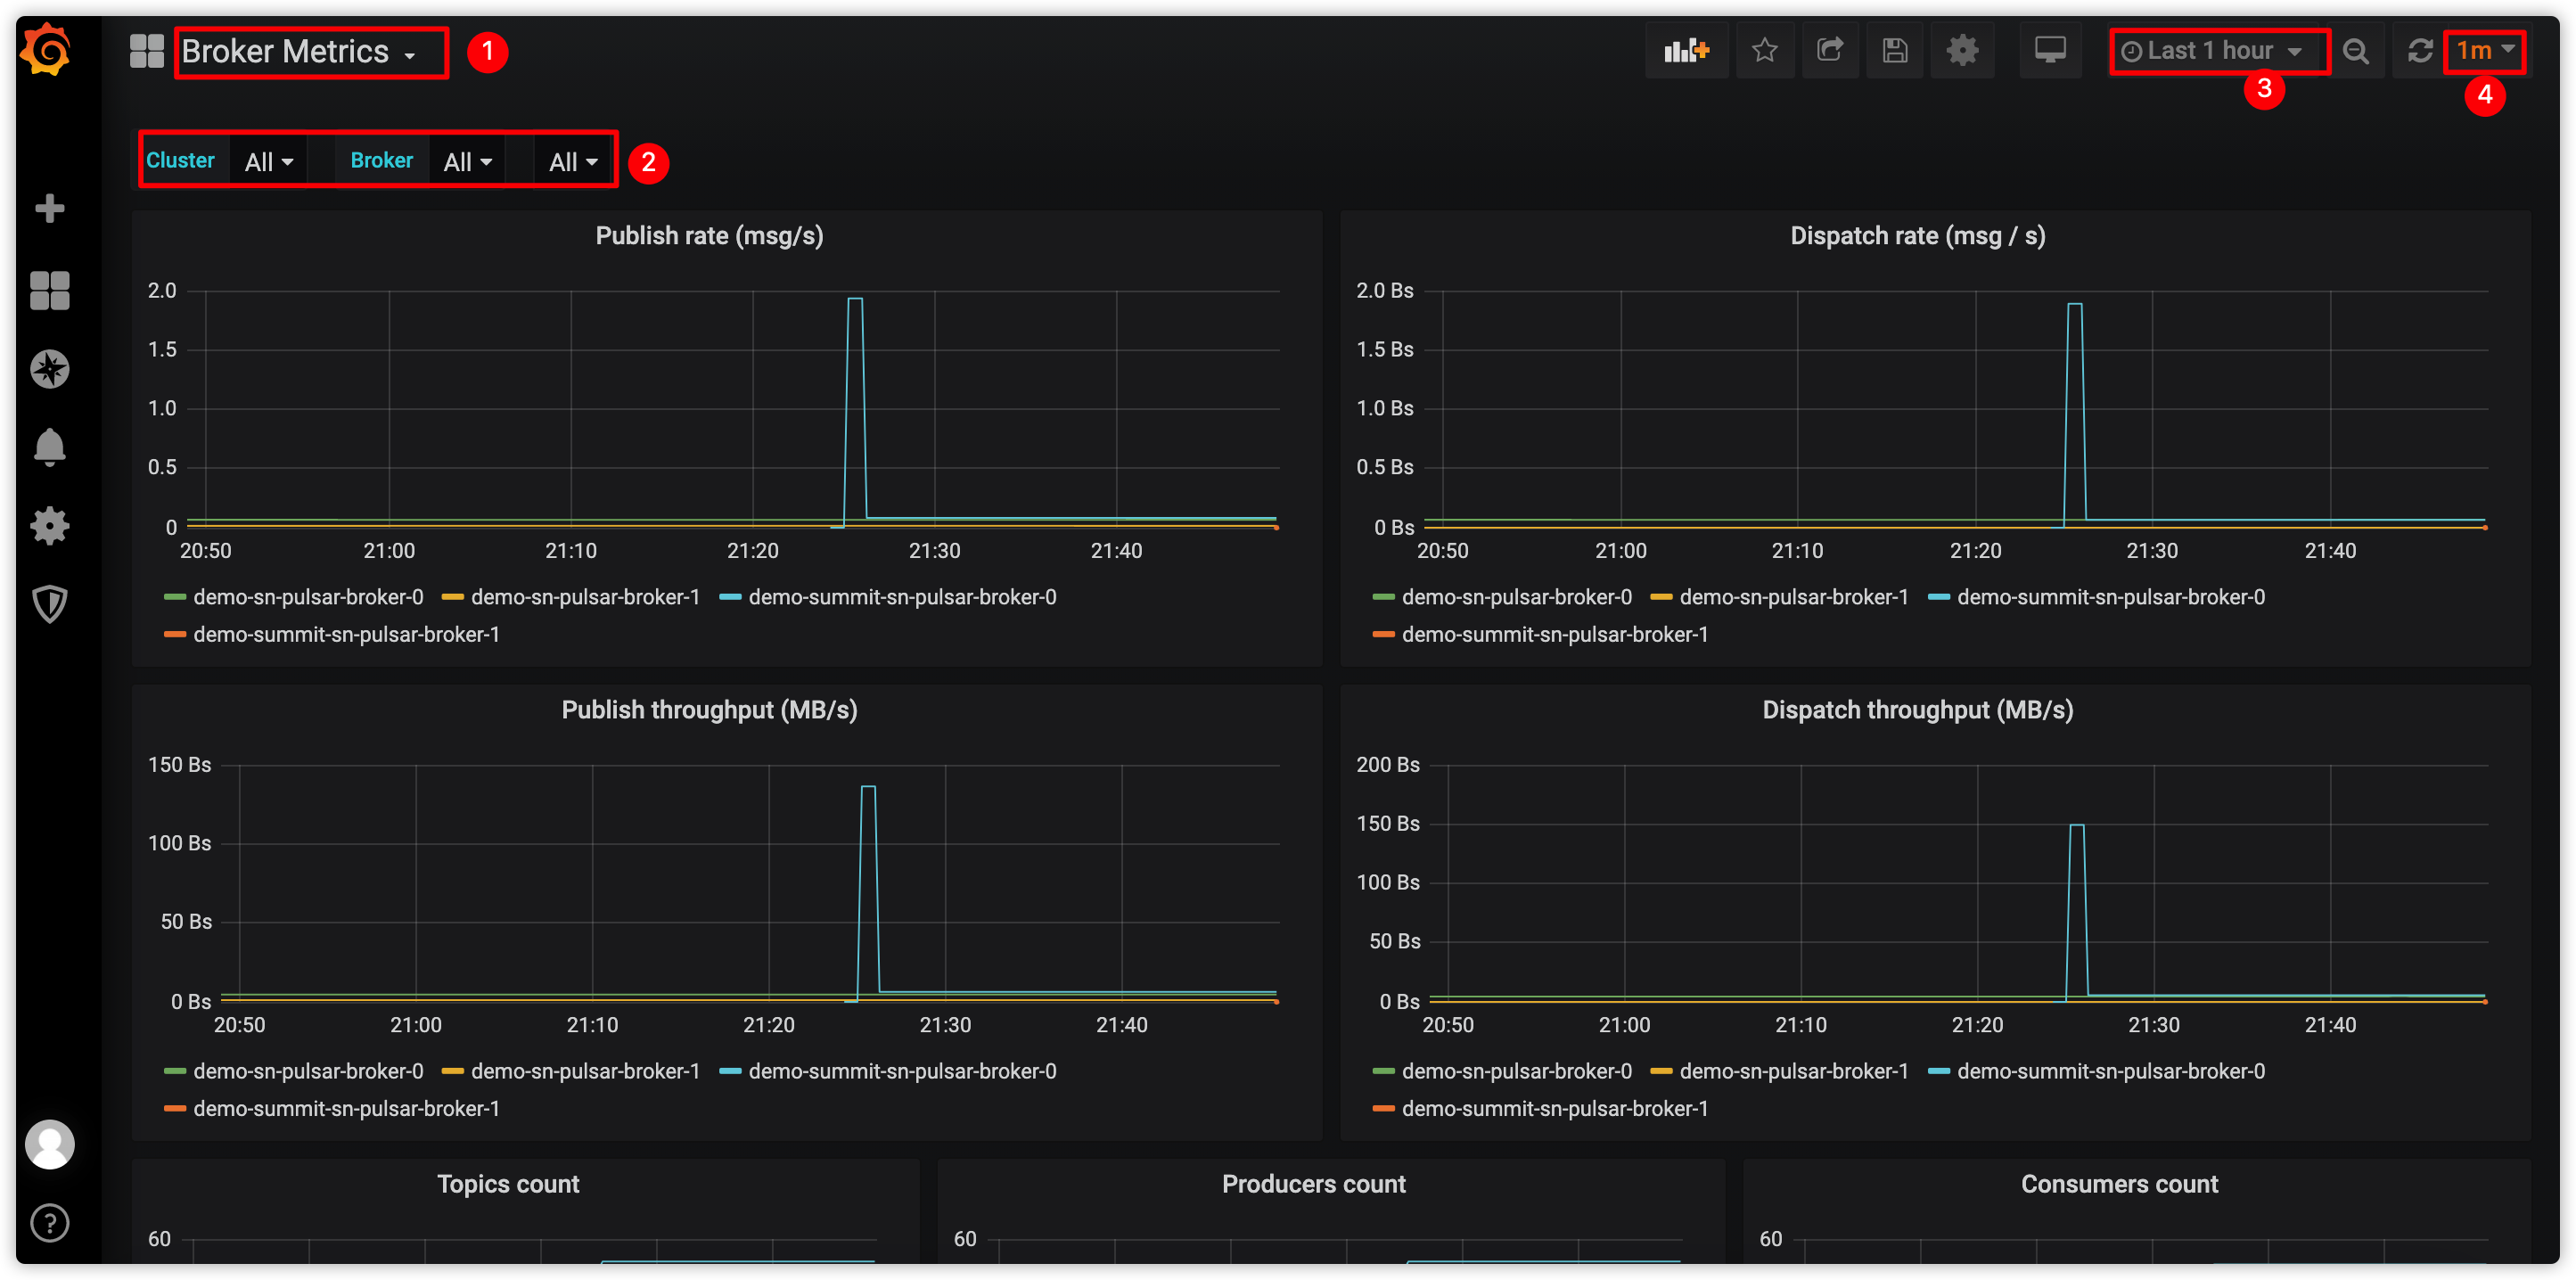
This figure shows how to monitor the Pulsar broker using the Grafana Dashboards.
## Use Grafana Dashboard
Grafana provides the following dashboards including brokers, bookies, ZooKeeper, proxy, topic, messages, and so on.
* *Overview*: Displays the overview health of a Pulsar cluster.
* *Messaging Metrics*: Displays the metrics related to Pulsar messaging (such as producers, consumers, message backlog and so on).
* *Proxy Metrics*: Displays the metrics related to Pulsar proxies if you have run proxies in your Pulsar cluster.
* *Bookie Metrics*: Displays the metrics related to Bookies.
* *ZooKeeper*: Displays the metrics related to ZooKeeper cluster.
* *JVM Metrics*: Displays the JVM related metrics of all the components in a Pulsar cluster (such as proxies, brokers, bookies, and so on).
* *Functions metrics*: Displays the metrics related to Pulsar Functions.
* *Auto Recovery*: Displays the metrics related to auto-recovery.
* *Container*: Displays the metrics related to the container.
*System metrics* are displayed in the *Node Metrics* dashboard and some portions in *Overview* dashboard.
This figure shows how to monitor the Pulsar broker using the Grafana Dashboards.
 | No. | Action |
| --- | ----------------------------------------------------- |
| 1 | Select a Broker Dashboard from the drop-down list. |
| 2 | Select to monitor all brokers or a specific broker. |
| 3 | Configure the time period for collecting the metrics. |
| 4 | Configure the interval for refreshing the dashboard. |
| No. | Action |
| --- | ----------------------------------------------------- |
| 1 | Select a Broker Dashboard from the drop-down list. |
| 2 | Select to monitor all brokers or a specific broker. |
| 3 | Configure the time period for collecting the metrics. |
| 4 | Configure the interval for refreshing the dashboard. |